Data about Earth’s vital signs is growing in leaps and bounds, and soon anyone will be able to monitor greenhouse gases in cities, states, and countries by using their mobile phone.
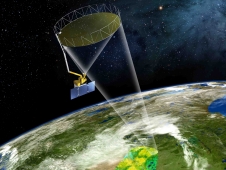
Last week, NASA launched the SMAP Observatory (Soil Moisture Active Passive), the first satellite to collect data on how much moisture is in the soil everywhere on Earth.
SMAP is the third Earth-observing satellite launched by NASA over the past year. Along with the Global Precipitation Measurement Observatory and Orbiting Carbon Observatory, scientists are receiving unprecedented precise measurements as never before.

Amazingly, SMAP will peer into the top 2 inches of soil from space – day and night – tracking water movement in real time. The information will vastly increase the accuracy of weather and climate forecasts, including the ability to predict and monitor droughts and floods.
And since plant growth depends on the amount of water in the soil – and whether it’s frozen or thawed – SMAP will allow nations to better forecast crop yields, track changes in the length of growing seasons due to climate change and the amount of carbon plants remove from Earth’s atmosphere each year.
Greenhouse Gas Emissions Get Very Accurate
There are also big advances in the ability to measure greenhouse gas (GHG) emissions.
While carbon emissions have been measured from the ground for decades using the Keeling Curve – which tells us we have exceeded 400ppm – scientists can’t pinpoint where the emissions are coming from and can’t get more detail than how much carbon is in the air over time.
NASA’s Carbon Observatory is the first to measure carbon from space, giving us precise, global measurements of the amount of carbon dioxide in the atmosphere. Combined with ground-based sensors, scientists can pinpoint exactly where carbon emissions are coming from down to individual factories, for example. It can also identify carbon sinks – where carbon is best absorbed, with the goal of protecting those places.
Last year, Europe’s space agency, Airbus Defence and Space, launched the "Emissions Measurement Service" which complements NASA’s efforts. It will provide accurate assessments of GHG – going beyond carbon to include methane and carbon monoxide – and with the ability to quantify emissions at city, state and country levels.
Methane leaking from landfills, oil refineries and all small-scale sources of emissions will be catalogued, as well as emissions from the world’s oceans for the first time.
By combining measurements on the ground, in the air and from the CarbonSat Earth Explorer-8 satellite, scientists will be able to monitor and verify if GHG levels are declining because of efforts to reach climate targets.

For example, what’s the real impact of policies that encourage energy from biomass, nuclear, and renewable energy? Can we see results on the local level that GHG are coming down?
Mobile Friendly
To make this data easily and freely available to policy-makers, scientists and everyone else, the World Resources Institute developed a tool anyone can use.
Having a discussion where you need quick statistics on how much emissions England generates each year? Using their Climate Analysis Indicators Tool (CAIT 2.0), stakeholders around the world can visualize and compare GHG emissions and other climate data from 186 countries worldwide – including all 50 US states – using smart phones, iPads and tablets.
With this level of accuracy and transparency, we will soon know which corporations, cities and national governments are meeting their climate targets – where and how they can improve – giving us a level of information and accountability we’ve never had before.
Check out CAIT 2.0:

very well, indeed!
see http://www.nmrhengelo.nl