In advance of introducing landmark regulations on existing power plants, the EPA released a report that shows how our climate is changing in the US.
"Temperatures are rising, snow and rainfall patterns are shifting, and more extreme climate events – like heavy rainstorms and record high temperatures – are already taking place," they state.
In the third edition of Climate Change Indicators in the United States, EPA summarizes data on 30 key measures, including: temperature and precipitation levels; ocean heat and acidity; water levels and temperature in the Great Lakes; sea levels; length of growing season; and wildfires, among others.
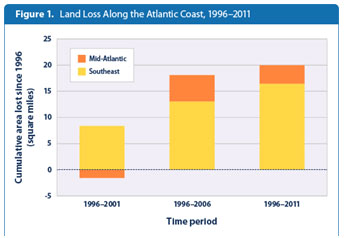
It even measures the earlier bloom dates of cherry blossoms in Washington DC (they peak 5 days earlier now), wintering ranges of birds, and land loss along the Atlantic coast.

As does the US National Climate Assessment, EPA’s report presents clear evidence on the current impacts of climate change – or, just look out the window.
EPA data shows:
- Significant average temperature rise over the past 30 years, with seven of the top 10 warmest years on record since 1998;
- Dramatic increase in tropical storms in the Atlantic Ocean, Caribbean, and Gulf of Mexico over the past 20 years;
- Rapid sea levels rise, particularly along the Atlantic and parts of the Gulf Coast, with some stations registering increases of over 8 inches from 1960-2013;
- Accelerated glacial melt, particularly in the past decade, which is contributing to sea level rise.
- Higher average temperatures across the Southwest from 2000-2013, with some areas nearly 2 degrees F warmer.
- Of the 10 years with the largest acreage burned from wildfires, nine have occurred since 2000.
- Climate change is affecting peoples’ health through, for example, greater incidence of Lyme disease and heat-related deaths.
Read the report:
