
The first BioCycle “State of Garbage in America” survey was conducted in 1988-1989. Much has changed since the pioneering times of the Earth Days in the 1970s when recycling drop-offs were held in grocery store parking lots and compost piles were maintained by gardeners who knew the value of resource recovery.
Those early surveys – based on information provided by states – revealed that 250 million tons of municipal solid waste (MSW) were generated annually. With roughly 250 million citizens, each of us generated one ton per year.
Now we fast forward to 2005-2006. For this year’s survey – based on 2004 MSW management data – we found that an estimated 388 million tons of MSW was generated, for an average of 1.3 tons per person per year. We’re still making more garbage. Out of that, 110.4 million tons were recycled and composted (28.5%), 28.9 million tons were combusted (7.4%; almost all in waste-to-energy plants), and 248.6 million tons were landfilled (64.1%).
So, we’re making more garbage, but we’re also recycling more. Compared to two years ago, we’re recycling 28.5%, up from 26.7%. Recyclable and compostable materials comprise upwards of 60% of the MSW stream and they’re still being dumped.
California is a case in point. About 41 million tons of solid wastewere disposed in the state’s landfills in 2003. Of that, 21 million tons consisted of organics and paper.
Some Details
From 2004 – 2006, recycling increased a bit (see above), MSW combustion decreased slightly (7.7% to 7.4%), as did landfilling (65.6% to 64.1%). The total amount of garbage generated increased by 5.5% – from 483 million tons to 509 million tons. (keep in mind, 2004 results are based on 2002 data).
The estimated MSW per capita generation rates varied from South Dakota’s low of 0.7 to Indiana’s 2.1 tons/person/year. Our population has grown by 1.8% during those years – from 288 million to 293 million – for 2002, each person generated 1.68 tons and in 2004, each person generated an average of 1.74 tons per year.
Imports/ Exports
Significant tonnages of solid waste continue to cross state borders. As in previous years, Pennsylvania imports the most waste, receiving 10.6 million tons of waste in 2004 (most of which was landfilled). Michigan is second with 6 million tons, and Virginia is third with 5.9 million tons. Ohio and Illinois also import significant amounts.
Maryland ranks highest for exporting waste (2.6 million tons). New Jersey is second (2.5 million), New York is third (2.2 million), and Missouri ranks fourth (2.17 million). Other states exporting over a million tons include Massachusetts, North Carolina and Washington.
The Recycling Scene
Several states recycle roughly 40% or more, including California (39.6%), Iowa (39.6%), Minnesota (43.2%), and Oregon (45.87%), all of which had similar recycling rates in 2002.
Several states significantly increased recycling rates: New York (43% from 29.8%), Washington (40.5% from 34.1%) and Tennessee (42.2% from 26.4%).
And several states decreased by 10% or more: Maine (34.5% from 49%), Arkansas (19.7% from 36.3%) and Delaware (10.4% from 20.4%).
Organics – including wood – contributed 18.5% of all materials recycled. This is down from 28% reported two years ago, but the reasons aren’t clear. Is it due to greater recycling of non-organics? Is it due to reporting issues?
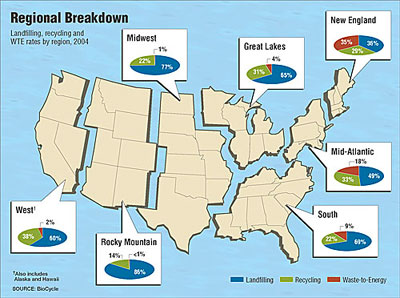
Here’s a larger size of the map. 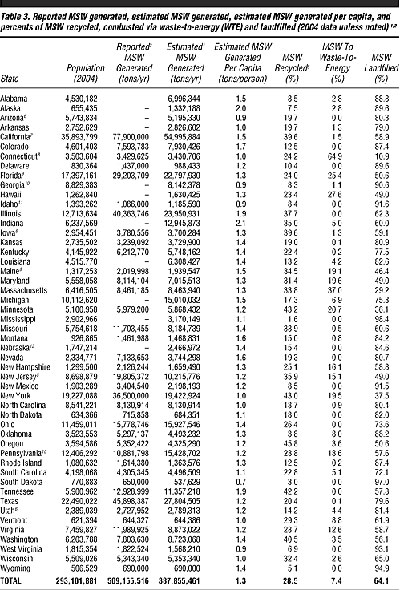
Here’s a larger size of this table.
++++
Excerpted FROM Biocycle, Journal Of Composting & Organics Recycling, a SustainableBusiness.com Content Partner.