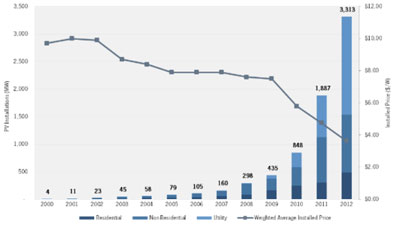
2012 was a record year for solar in the US, growing 76%. 3.3 GW were installed – more than 300,000 solar PV systems.
That’s 11% of all solar PV installed in the world during 2012, the highest market share in at least 15 years, according to the annual update by the Solar Energy Industries Association (SEIA).
The US now has 7.22 GW of solar PV and 546 MW of concentrating solar, enough to power 1.2 million homes!
Weighted average PV system prices fell 27% in 2012, reaching $5.04 per watt in the residential market, $4.27 per watt in the non-residential market, and $2.27 per watt for utilities.
Even as the cost of solar dropped substantially, the market size of the U.S. solar industry grew 34% – from $8.6 billion in 2011 to $11.5 billion in 2012.
Here’s how much solar PV (in megawatts) was added in the top states during 2012:
California – 1,033 MW
Arizona – 710
New Jersey – 415
Nevada – 198
North Carolina – 132
Massachusetts – 129
Hawaii – 109
Maryland – 74
Texas – 64
New York – 60
Last year, California was the first state to pass the threshold of 1 gigawatt of solar PV. Now, New Jersey has also passed that milestone, where solar PV grew 33% last year.
The non-residential market – commercial, government and nonprofits – added more than 1 GW of solar last year.
The utility market continues to be dominated by big projects in the desert southwest – 152 added in 2012, represent 54% of total installed capacity – 1.78 GW.
For 2013, the forecast is for 4.3 GW of new PV installations, up 29%, and 946 MW of concentrating solar, as huge projects under construction come online.
"All of these data point to solar having turned the corner," says Rhone Resch, CEO of SEIA. "Solar is an affordable option for homes and businesses today, and is well on its way to becoming a substantial part of America’s energy portfolio."
The US solar industry is adding jobs much faster than the rest of the economy – over the past year, solar jobs grew eight times faster than the overall economy. It employs an estimated 119,000 Americans at 5,600 companies, mostly small businesses.
US Solar PV Installations and Weighted Average Installed Price for residential (deepest blue), non-residential (medium blue) and utility (light blue). The down-trending line is the average installed price.

2011 was also a fantastic year for US solar, growing 109%.
Read U.S. Solar Market Insight: Year-in-Review 2012:
